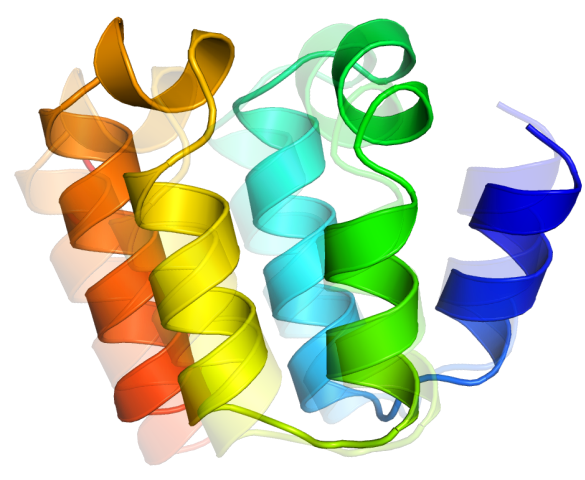
We evaluate the performance of various inverse-folding models for structure-based sequence design, focusing on two distinct objectives: natural evolutionary fitness (in-distribution proteins) and de novo designed backbone-based sequence design. The latter represents an out-of-distribution problem that tests the robustness of the methods, as these structures typically contain some noise different from high-resolution structure deposited in PDBs.
The following table shows the performance of structure-based sequence design models on inverse folding tasks. The reported results are the median of repetitive experiments. ’N/A’ stands for not applicable. ESMIF1 and ESM3 use all native structures and sequences for model training, therefore, they not measured in the evolution distribution fitting objective.
| Model | Fitting Evolution Distribution | De novo backbones based sequence design | ||||||||||
|---|---|---|---|---|---|---|---|---|---|---|---|---|
| CASP AAR ↑ | CAMEO AAR ↑ | length 100 scTM ↑ | length 100 pLDDT ↑ | length 200 scTM ↑ | length 200 pLDDT ↑ | length 300 scTM ↑ | length 300 pLDDT ↑ | length 400 scTM ↑ | length 400 pLDDT ↑ | length 500 scTM ↑ | length 500 pLDDT ↑ | |
| ProteinMPNN | 0.450 | 0.468 | 0.962 | 94.14 | 0.945 | 89.34 | 0.962 | 90.28 | 0.875 | 83.76 | 0.568 | 67.09 |
| ESM-IF1 | N/A | N/A | 0.810 | 88.83 | 0.635 | 69.67 | 0.336 | 74.36 | 0.449 | 64.59 | 0.462 | 58.97 |
| LM-Design | 0.516 | 0.570 | 0.834 | 78.45 | 0.373 | 58.41 | 0.481 | 69.86 | 0.565 | 59.87 | 0.397 | 56.35 |
| ESM3 | N/A | N/A | 0.942 | 86.60 | 0.486 | 60.69 | 0.632 | 70.78 | 0.564 | 62.63 | 0.452 | 59.37 |


